Drillthrough report in SSRS Step by Step
Drillthrough report in SSRS
A Drillthrough is a kind of report that a user opens by
clicking a link within another report. Drillthrough reports commonly contain details
about an item that is contained in an original summary report. The data in the drillthrough report is not retrieved until the
user clicks the link in the main report.
Here I am showing you how to create
Drillthrough Report.
For this I am creating two Report i.e. Parent and Child Report.
Here is an
example from AdventureWorks Database for Parent
Report.

SQL Scripts
SELECT
CustomerID, ContactID, Demographics, ModifiedDate
FROM
Sales.Individual
Now insert a table and Format the column

And Now create a Child Report
Here I am also
using AdventureWorks Database for Child
Report.

SQL Scripts
SELECT
CustomerID, ContactID, Demographics, ModifiedDate
FROM
Sales.Individual
WHERE
(CustomerID = @CustID)
Here I am creating a Parameter Custid.
Here both report created and now its time to map the parent
report to child report. For this
We go to the parent report [CustomerID] column.
Right
click on [CustomerID] column
and choose Text
Box Properties

Go to Action tab and map these:

Then Click on OK.
And now
run the report. Below the preview of Drillthrough report.

Sunday, 29 July 2012
Page Break at Nth row in SSRS Report Step by Step
We can design a SSRS
report with a constraint of only Nth rows per page.
I am showing you that
how to display only Nth rows in the report in this article.
Here is an example
from AdventureWorks Database.

SQL Scripts.
SELECT TOP 1000 [StateProvinceID]
,[StateProvinceCode]
,[CountryRegionCode]
,[Name]
,[rowguid]
,[ModifiedDate]
FROM
[AdventureWorks].[Person].[StateProvince]
Select the Header Row of the table in the report.
Go to Properties Window.
Under the BackgroundColor property,
Select color from drop down.

Now create a group.

After creating the group go to the group properties
and click on fx button.

And set the expression for group properties.

Expression :
=Ceiling((RowNumber(Nothing)) / 15)
( Note : You can put Nth
number in place of 15. For example if you want to your page break affect after
each 25th row than you have to put 25 in place of 15 )
Now, report
will show 15 rows in a group. Next step is to define page break for the group.
Go to page breaks tab and select page break option.

And now run the
report. Below the preview of
report.

Tuesday, 24 July 2012
Create SSRS report using Excel Data Source Step by Step
By creating a report using Excel as a Data Source we will follow the following steps ...


Click on OK.


Right click on Shared Data Source folder and choose Add New Data
Source. A new popup screen will open. Give the Data Source Name and Choose
ODBC
from the dropdown box.

Then
Click on Edit
button. A new screen will open. From the new screen i.e. Connection
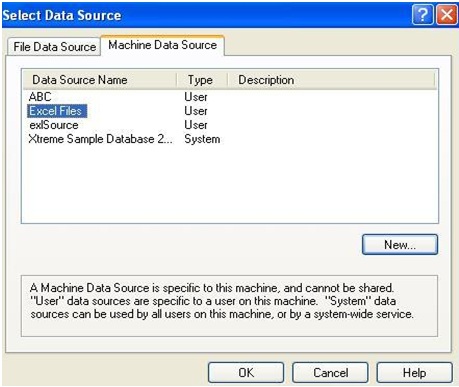
Properties go to the Use user or system data source name and from the drop
down choose Excel
Files .

Then Choose the Use Connection String and click on Build
button. A new pop up screen will open . Click on New button.

Then click on Next button

Choose the Microsoft Excel Driver and click on Next button
and then click on Finish button.

Then click on Select Workbook button and choose the file and
click on OK
button.


Click on OK.

Test the connection and press OK.


Click on OK.
Click on Reports folder and choose add new items and choose Report. Map
your Data Source and click OK.

Right click on Dataset Folder and Write the query for the
table. (I have used a very simple query .For ex.)

This is Your Report from Excel data source.

Sunday, 17 June 2012
Alternating Table Row Color In SSRS Step by Step
Alternating Table Row
Color In SSRS Step by Step
Here is an example from
AdventureWorks Database.

Sql Script.
SELECT TOP 1000
[StateProvinceID]
,[StateProvinceCode]
,[CountryRegionCode]
,[Name]
,[rowguid]
,[ModifiedDate]
FROM
[AdventureWorks].[Person].[StateProvince]
Select the Header Row of
the table in the report.
Go to Properties Window.
Under the BackgroundColor property,
Select color from drop down.

Now, Select the Data Row of
the table in the report.
Go to Properties Window.

Under the BackgroundColor property,
select expression from the drop down.
Enter the expression "=IIF(RowNumber(Nothing) mod 2 = 0, "SeaGreen","Pink") " in the Expression Window.

Click OK.
Below is a Preview of a SSRS
report with two different colors for alternate rows.

Monday, 9 April 2012
How do you create share schedule in SSRS
Q:
How do
you create share schedule in SSRS ?
To create shared schedules
- Click Site Actions.
- Click Site Settings.
- In the Reporting Services section, click Manage Shared Schedules.
- Click Add Schedule to open the Schedule Properties page.
- Enter a descriptive name for the schedule. On the application pages used to work with Reporting Services reports, this name will appear in drop-down lists in schedule definition pages throughout the site. Avoid long names that are hard to read. Do follow a naming convention that puts the most description information at the beginning of the name.
- Choose a frequency. Depending on the frequency you choose, the schedule options that appear on the page might change to support that frequency (for example, if you choose Month, the name of each month will appear on the page).
- Define the schedule. Not all schedule combinations can be supported in a single schedule.
- Set a start and end date.
- Click OK. Read more ...
Sunday, 8 April 2012
What is difference between table and metrix report in SSRS
Q: What is difference between table and metrix
report in SSRS ?
Table : Table report is just like a grid view.
Matrix : Matrix report gives us cross tab view
it is also known as pivot report .
What are data regions
Q: What are data regions ?
Data regions are report items that display
repeated rows of summarized information from the data set. For
ex. Table,
Matrix, Chart etc.
Friday, 30 March 2012
SSRS Basic Interview Questions And Answers - Part 3
Q: What is report server in SSRS?
A
report server is a stateless server that uses the SQL Server Database
Engine to store metadata and object definitions. It consists of a
pair of core processors plus a collection of special-purpose extensions
that handle authentication, data processing, rendering, and delivery
operations. Processors are the hub of the report server.
Q: Difference between report manger and report server in SSRS?
The
report server is the central component of a Reporting Services
installation. It consists of a pair of core processors plus a collection
of special-purpose extensions that handle authentication, data
processing, rendering, and delivery operations. Processors are the hub
of the report server.
Report
Manager is an ASP.NET web application that provides report
management/viewing capabilities for a Reporting Services instance
configured in native mode.
The
configuration settings of Report Manager and the Report Server Web
service are stored in a single configuration file
(rsreportserver.config).
You can also use "Reporting Services Configuration Manager" to configure settings for Report Server and Report Manager.
Q: What is subscription Type?
Snapshot-Based Subscriptions
Notification is sent whenever a snapshot is created
Schedule-Based Subscriptions
Uses a custom schedule (e.g., daily, monthly, etc.)
Can have start and stop dates
Data-Driven Subscriptions
Report recipients are defined by a query
Table and query must be created manually
Useful when managing large or very dynamic lists of recipients
Tuesday, 27 March 2012
SSRS Basic Interview Questions And Answers - Part 2
Q: What
is difference between SSRS 2005 and 2008 ?
Difference between SSRS 2005 and SSRS 2008
|
|
SQL Server 2005
Reporting Services
|
SQL Server 2008
Reporting Services
|
Multiple service architecture (IIS Service & Windows
Service)
|
Single service architecture (Windows Service)
|
Depends on IIS
|
Comes with Built-In Web Server and hence does not depend on
IIS
|
Complex deployment due to the need for separate configuration
for IIS
|
Deployment is simple due to inbuilt web server and Reporting
Services Configuration Manager
|
Charts, Dials etc. had to be separately installed and
integrated
|
Comes packaged with Charts, Dials, Indicators, Sparklines etc.
|
Limited exporting options
|
More exporting options including Microsoft Word etc
|
No comments:
Post a Comment